Forecast energy curve
For the forecast energy curve, three scenarios cover each sent out energy and consumed energy, as shown in the table below.
Table 32 Forecast energy bands
|
Energy type |
10% POE |
50% POE |
90% POE |
|---|---|---|---|
|
Sent out (ASOE) |
Zero sent out generation |
Predispatch |
Predispatch |
|
Consumed (ACE) |
Estimation coefficient and predictor variables using 10% POE forecast region demand |
Estimation coefficient and predictor variables using 50% POE forecast region demand |
Estimation coefficient and predictor variables using 90% POE forecast region demand |
Consumed energy is calculated using the following formula:
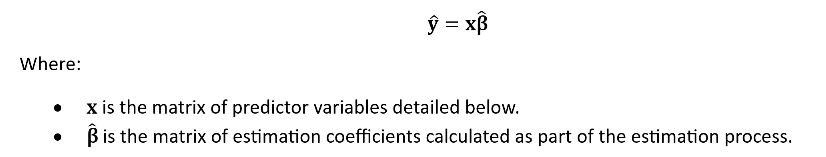
Consumed energy calculations uses the following predictor variables:
-
Region demand.
-
Business day vs non-business day, as single numerical variable with a value of 1 or 0.
-
Date predicted as an ordinal number in the time series sequence.
-
Period ID as 287 categorical variables for each interval in a day, 1 less than 288 period to avoid over fitting.
Where available, any known region demand values are used, otherwise, these values are taken from the Demand The amount of power consumed at any time Forecasting System.
See the Multiple linear regression model section of the Settlements Estimation Guide for more information on the calculations used for forecasting consumed energy.