View Intermittent Generation forecasts
About viewing forecasts
In this menu you can:
- View a summary of forecasts
- View forecasts
You can view forecasts by selecting the following criteria:
- The Forecast Unit A Scheduled, Semi-Scheduled, or Non-Scheduled Generating Unit (Unit ID A semi-scheduled generating unit or a non-scheduled generating unit or region ID).
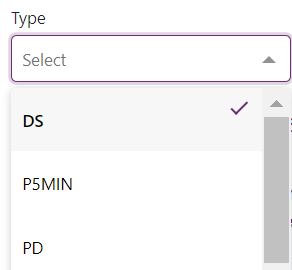
- The Forecast Type (DS Dispatch, P5MIN 5 minute pre-dispatch, PD Pre-dispatch, STPASA Short-term Projected Assessment of System Adequacy. 30 minute resolution, seven days ahead. A daily load forecast showing expected demand two to seven days ahead of time.).
- The Forecast Run date range.
You can then select from the list of forecast runs based on the selected criteria.
Intermittent Generation forecast information is available in the following forms:
- Tabular
- Graphical
Viewing forecasts
To view Forecasts:
- Click Intermittent Generation > Forecasts.
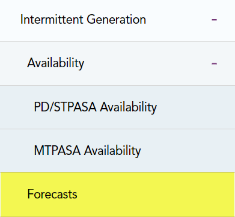
- The Intermittent Forecasts interface displays where you can make your selection criteria.
Participants can view DS, PD, 5MPD 5-minute Pre-dispatch, and STPASA.
- For their units for historical and current runs.
- For other units for historical runs only up to the end of previous Trading Day See Relevant Rules or Procedures.
Select a set of forecasts
You can choose a set of forecast runs and show the latest in the set by selecting the:
- Unit: for help, see Select the unit.
- Type: for help, see Select the type.
- Date To: for help, see Select a date.
Select a forecast run
You can choose a particular forecast run from the set (derived above) and show the data by selecting the:
- Runs: For help, see Select runs.
Select forecast view
You can select how you want to see the forecast run by:
- Graphical display: for help, see Select the graphical display.
- Tabular display: for help, see Select the tabular display.
Change the date to
The initial default date is the current day. You can set the end-date of the date range.
To select another end-date for the range:
- Click the icon to the right of the Date To item to show the calendar, and then click on a date, see Select a date.
- Selecting a date causes the forecast data to display, seeSelect the graphical display and Select the tabular display.
Select runs
Selecting the Unit, Type and Date To causes the set of relevant forecast runs to be updated. The date range depends on the Type; see Change the date to. The most recent run in the list is shown by default. You can choose to view any run in the list.
To select a particular run:
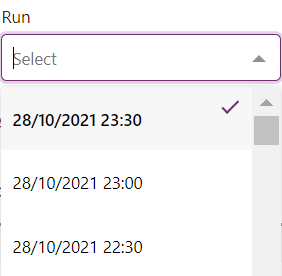
- Click the down-arrow to the right of the Runs item to show the list of runs, and then click a run. For help, Select the graphical display and Select the tabular display.
Download forecast csv files
Participants can view MT PASA region forecasts (not unit forecasts) using Data Interchange to retrieve the csv files. For more details, see Concise Guide to Data Interchange.
For all types except DS (dispatch), the csv file is the selected forecast run. For DS, the csv file is all dispatch forecasts for the selected day up to the selected forecast run. See Select the type.
To download one file:
- Click Export to CSV.
-
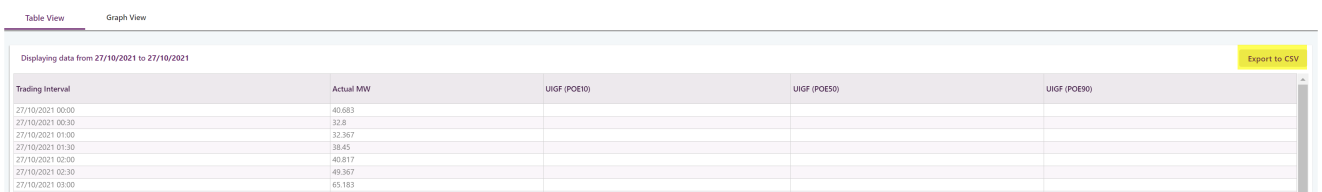
- The file is exported and download to your default download location.
For help with the csv format, see Last modified: 04 December 2024.
Select the graphical display
The graphical display presents the content of the Unit forecast as a time series plot with the forecasted power and targets set by NEMDE NEM Dispatch Engine (previously SPD). Software developed and used by AEMO to ensure the central dispatch process maximises value of trade, subject to the various constraints. (for periods when semi-dispatch cap applies) on the vertical axis y in MW Megawatt units and the date and time on the horizontal axis.
For all types except DS (dispatch), the graphical display is the selected forecast run. For DS, the graphical display is all dispatch forecasts for the selected day up to the selected forecast run. See Select the type.
To display the data graphically:
- Click the Graph View tab.
- Select a Type from the drop-down list.
- The data displays in a graphical format, for example:
Figure 58 Dispatch (DS) graphical display
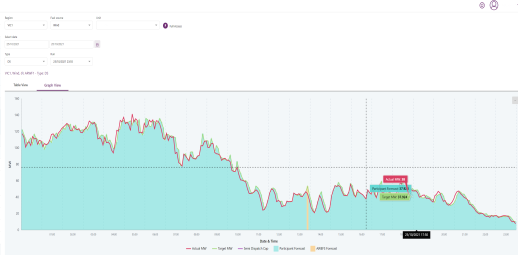
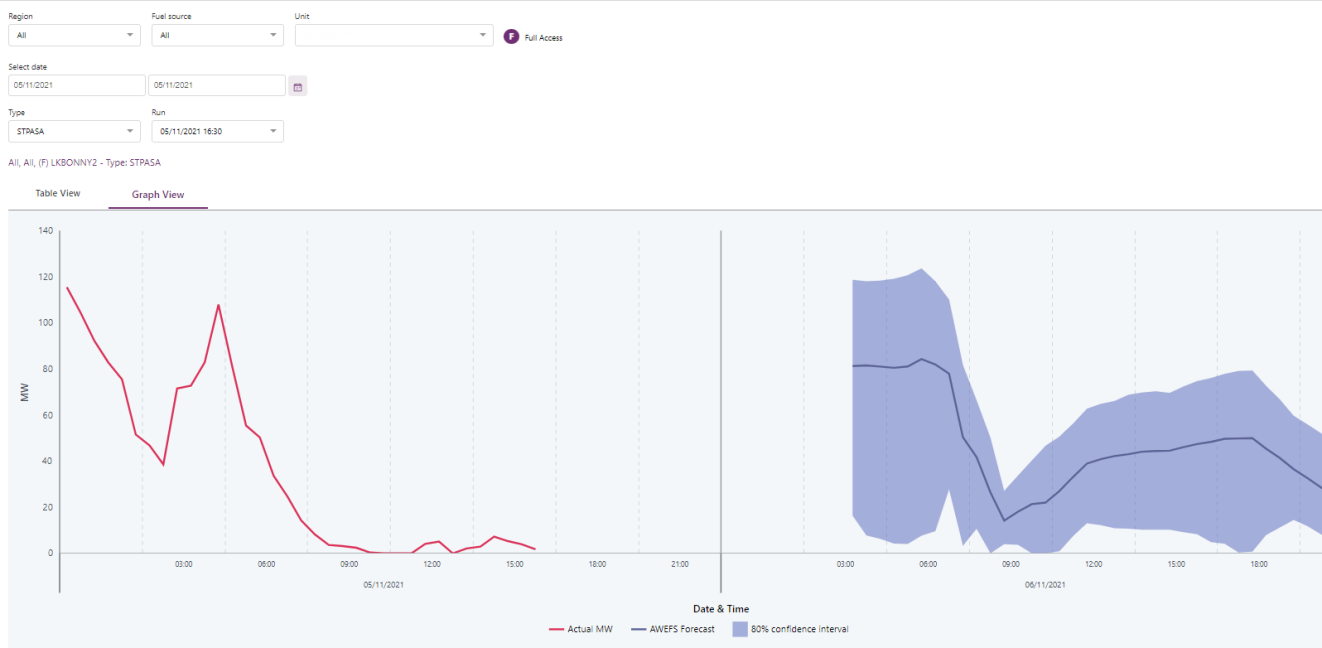
Figure 59 STPASA graphical display
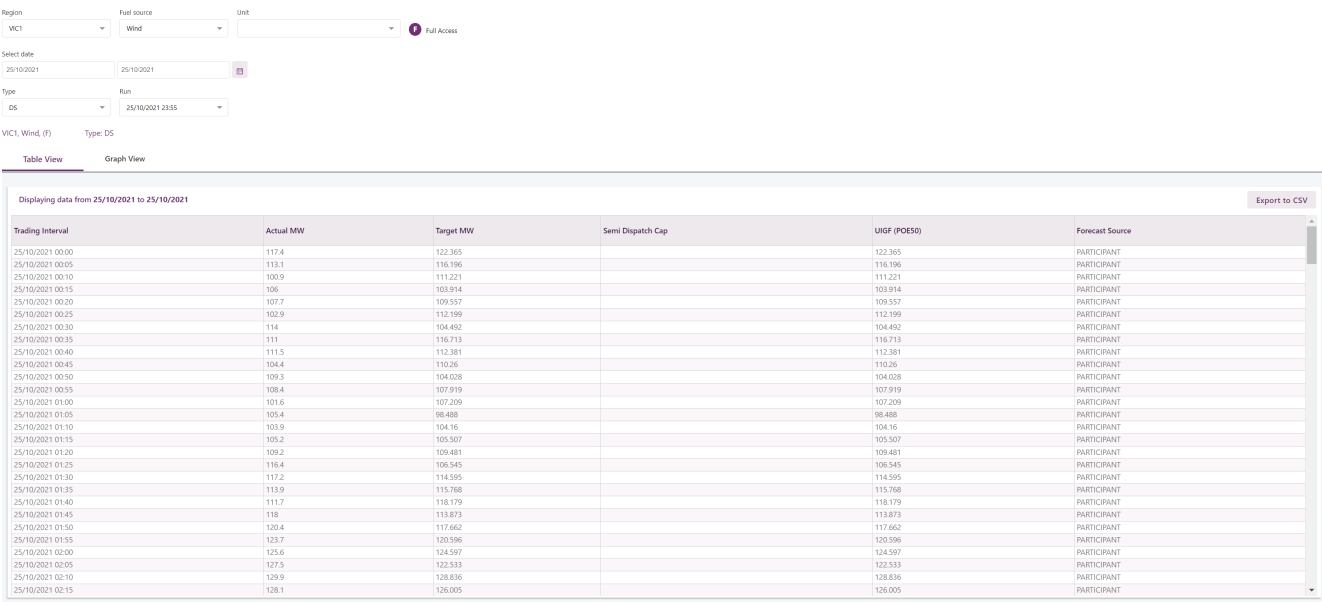
Select the tabular display
The tabular display presents all the content of the Unit forecast in a table form.
To display the data in table form:
- Click the Table View tab.
- Select a Type from the drop-down list, for example:

- The data displays in a tabular format, for example: